Winter Daylight Hours Math: December and January Learning Activities
Daylight hours math for December and January provides a natural, data-rich context for teaching core mathematical concepts related to time, measurement, and data analysis. During these months, observable changes in daylight occur at a predictable rate, making them especially useful for structured mathematical exploration in K–12 learning.
By studying the daily variation in daylight hours, students engage with authentic numerical data and apply mathematical reasoning to real-world phenomena—an approach strongly supported by research in mathematics education.
Defining Daylight Hours in Mathematical Terms
In mathematics, daylight hours are defined as the time interval between sunrise and sunset on a given day. This interval can be measured in hours, minutes, or converted into numerical values for comparison and analysis.
From a mathematical perspective, daylight hours allow students to work with:
- Time intervals as measurable quantities
- Subtraction of time values
- Sequential data collected over multiple days
- Rates of change over time
Unlike abstract word problems, daylight data is externally verifiable and consistent, reinforcing mathematical accuracy and precision.
Why December and January Are Ideal for Daylight Hours Math
December and January represent a unique period in the annual daylight cycle:
- December contains the shortest daylight duration of the year (winter solstice)
- January marks the beginning of a gradual, measurable increase in daylight
This transition allows students to observe:
- Minimum values
- Directional change
- Slow, incremental growth
These characteristics align closely with early concepts in functions, trends, and data interpretation.

Mathematical Skills Developed Through Daylight Hours Analysis
1. Measurement and Time Calculation
Students calculate daylight duration using the formula:
Daylight Duration = Sunset Time − Sunrise Time
This reinforces:
- Time subtraction
- Conversion between hours and minutes
- Multi-step calculation accuracy
Younger students may estimate or round values, while older students calculate exact durations.
2. Data Collection and Organization
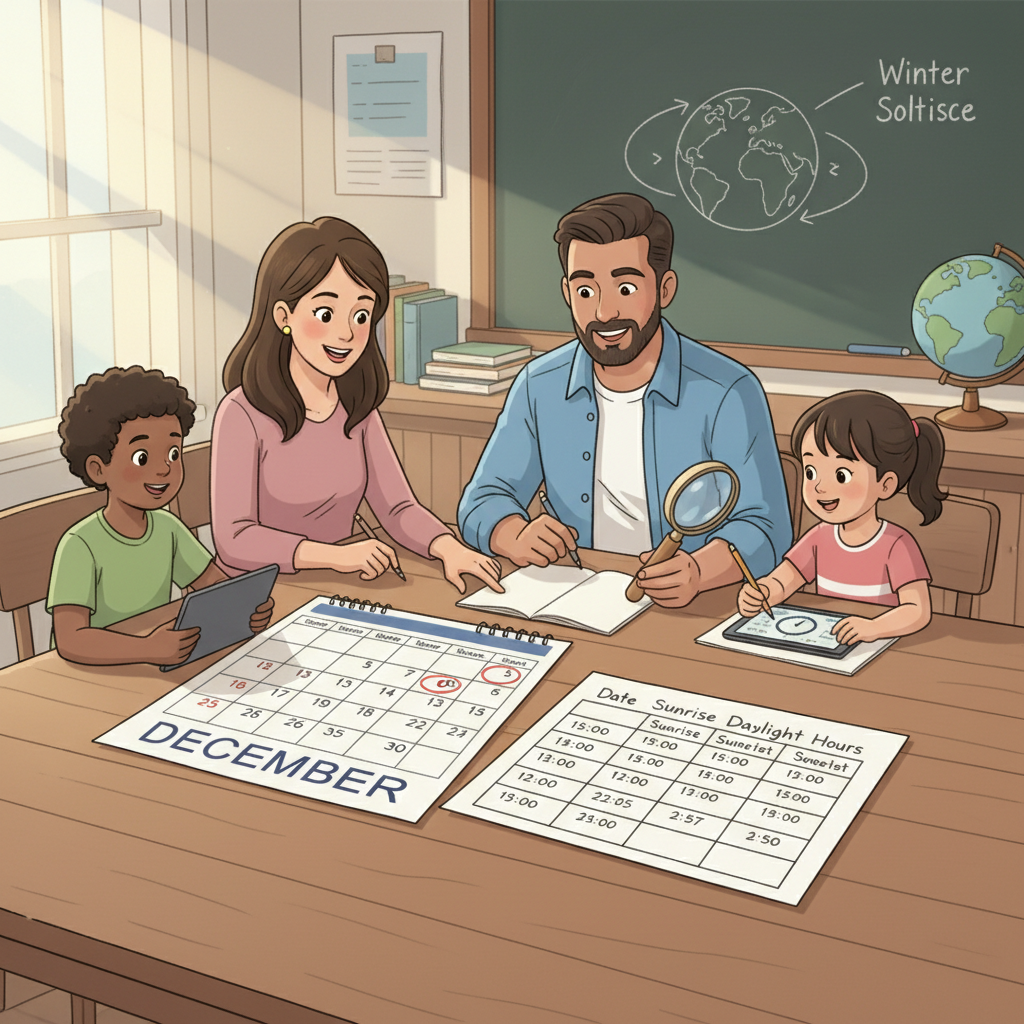
Students record sunrise and sunset times daily using reliable sources (calendars, weather data). This introduces:
- Tabular data representation
- Consistent units of measurement
- Chronological sequencing
Accurate data recording is a foundational skill in both mathematics and science.
3. Data Representation and Visualization
Collected daylight data can be represented using:
- Tables
- Line graphs
- Bar graphs
Students analyze:
- Lowest data points (shortest day)
- Directional trends (decrease → increase)
- Relative change between dates
This supports early statistical literacy and graph interpretation.
4. Comparative Reasoning and Quantitative Change
By comparing daylight durations across dates, students practice:
- Greater-than and less-than comparisons
- Absolute and relative change
- Reasoned explanations of numerical differences
Older students may calculate:
- Daily rate of change
- Weekly averages
- Differences between months
Cross-Disciplinary Connection: Mathematics Explaining Physical Phenomena
Daylight hours math also supports scientific reasoning. Once patterns are identified, students can connect the data to:
- Earth’s axial tilt
- Seasonal solar exposure
- The predictable nature of astronomical cycles
This reinforces the idea that mathematics is a language for describing natural systems, a key objective in STEM education.
Alignment with Academic Standards
Daylight hours math for December and January aligns with:
- Common Core Measurement & Data standards
- Mathematical Practices emphasizing reasoning and explanation
- Early algebraic thinking (pattern recognition and trends)
It also prepares students for future learning involving:
- Functions and graphs
- Scientific data analysis
- Modeling real-world phenomena mathematically
Final Takeaway: Daylight Hours as a Rigorous, Real-World Math Context
Daylight hours math for December and January provides a rare opportunity to teach time measurement, data analysis, and pattern recognition using real, observable data. By tracking sunrise and sunset, calculating daylight duration, and analyzing trends across weeks, students practice core mathematical skills in a context that is both concrete and academically meaningful.
To reinforce this learning with structured practice,
support the same skill areas emphasized in daylight hours analysis. Designed for Kindergarten through Grade 10, these worksheets help students strengthen mathematical explanation and precision
When real-world observation is paired with guided worksheet practice, students gain both conceptual understanding and computational accuracy. This combination helps transform seasonal phenomena into lasting mathematical knowledge—building a strong foundation for future learning in algebra, data science, and STEM subjects.
About Think Academy
Think Academy, part of TAL Education Group, helps K–12 students succeed in school today by building strong math foundations and critical thinking skills. At the same time, we focus on the bigger picture—developing learning ability, curiosity, and healthy study habits that inspire a lifelong love of learning. With expert teachers, proven methods, and innovative AI tools, we support every child’s journey from classroom confidence to long-term growth.
Check our math programs:
- Early Childhood — PreK
- Lower Elementary — Grades K–2
- Upper Elementary — Grades 3–5
- Middle School — Advanced math topics, including Algebra 1, Algebra 2, and Geometry
Want more insights on math learning and parenting? Fill out the form on this page and subscribe to our newsletter for weekly tips and the latest resources.
Leave a Comment & Share Your Thoughts!

Share This Story, Choose Your Platform!
Related Posts